Back in July, after Round 17, I wrote that 2026 felt different. The percentage said yes. The list trajectory said probably. The injury crisis meant we wouldn’t know for sure until 2027. The season is now done. So – what actually happened?
The Final Record
St Kilda finished the 2026 home-and-away season with 10 wins and 13 losses (plus two draws in the second quarter stats, but more on that shortly). We did not make finals. The wildcard format that briefly kept the dream alive wasn’t enough in the end.
And yet. The numbers underneath that record tell a more interesting story than the ladder position does.
Every Result – 2026
Wins (10) – Average winning margin: 36.3 points
| Round | Opposition | For | Against | Margin | Venue |
|---|---|---|---|---|---|
| 7 | West Coast | 22.11 (143) | 5.12 (42) | +101 | Marvel Stadium |
| 17 | Essendon | 17.15 (117) | 7.8 (50) | +67 | Marvel Stadium |
| 23 | Richmond | 14.10 (94) | 6.9 (45) | +49 | MCG |
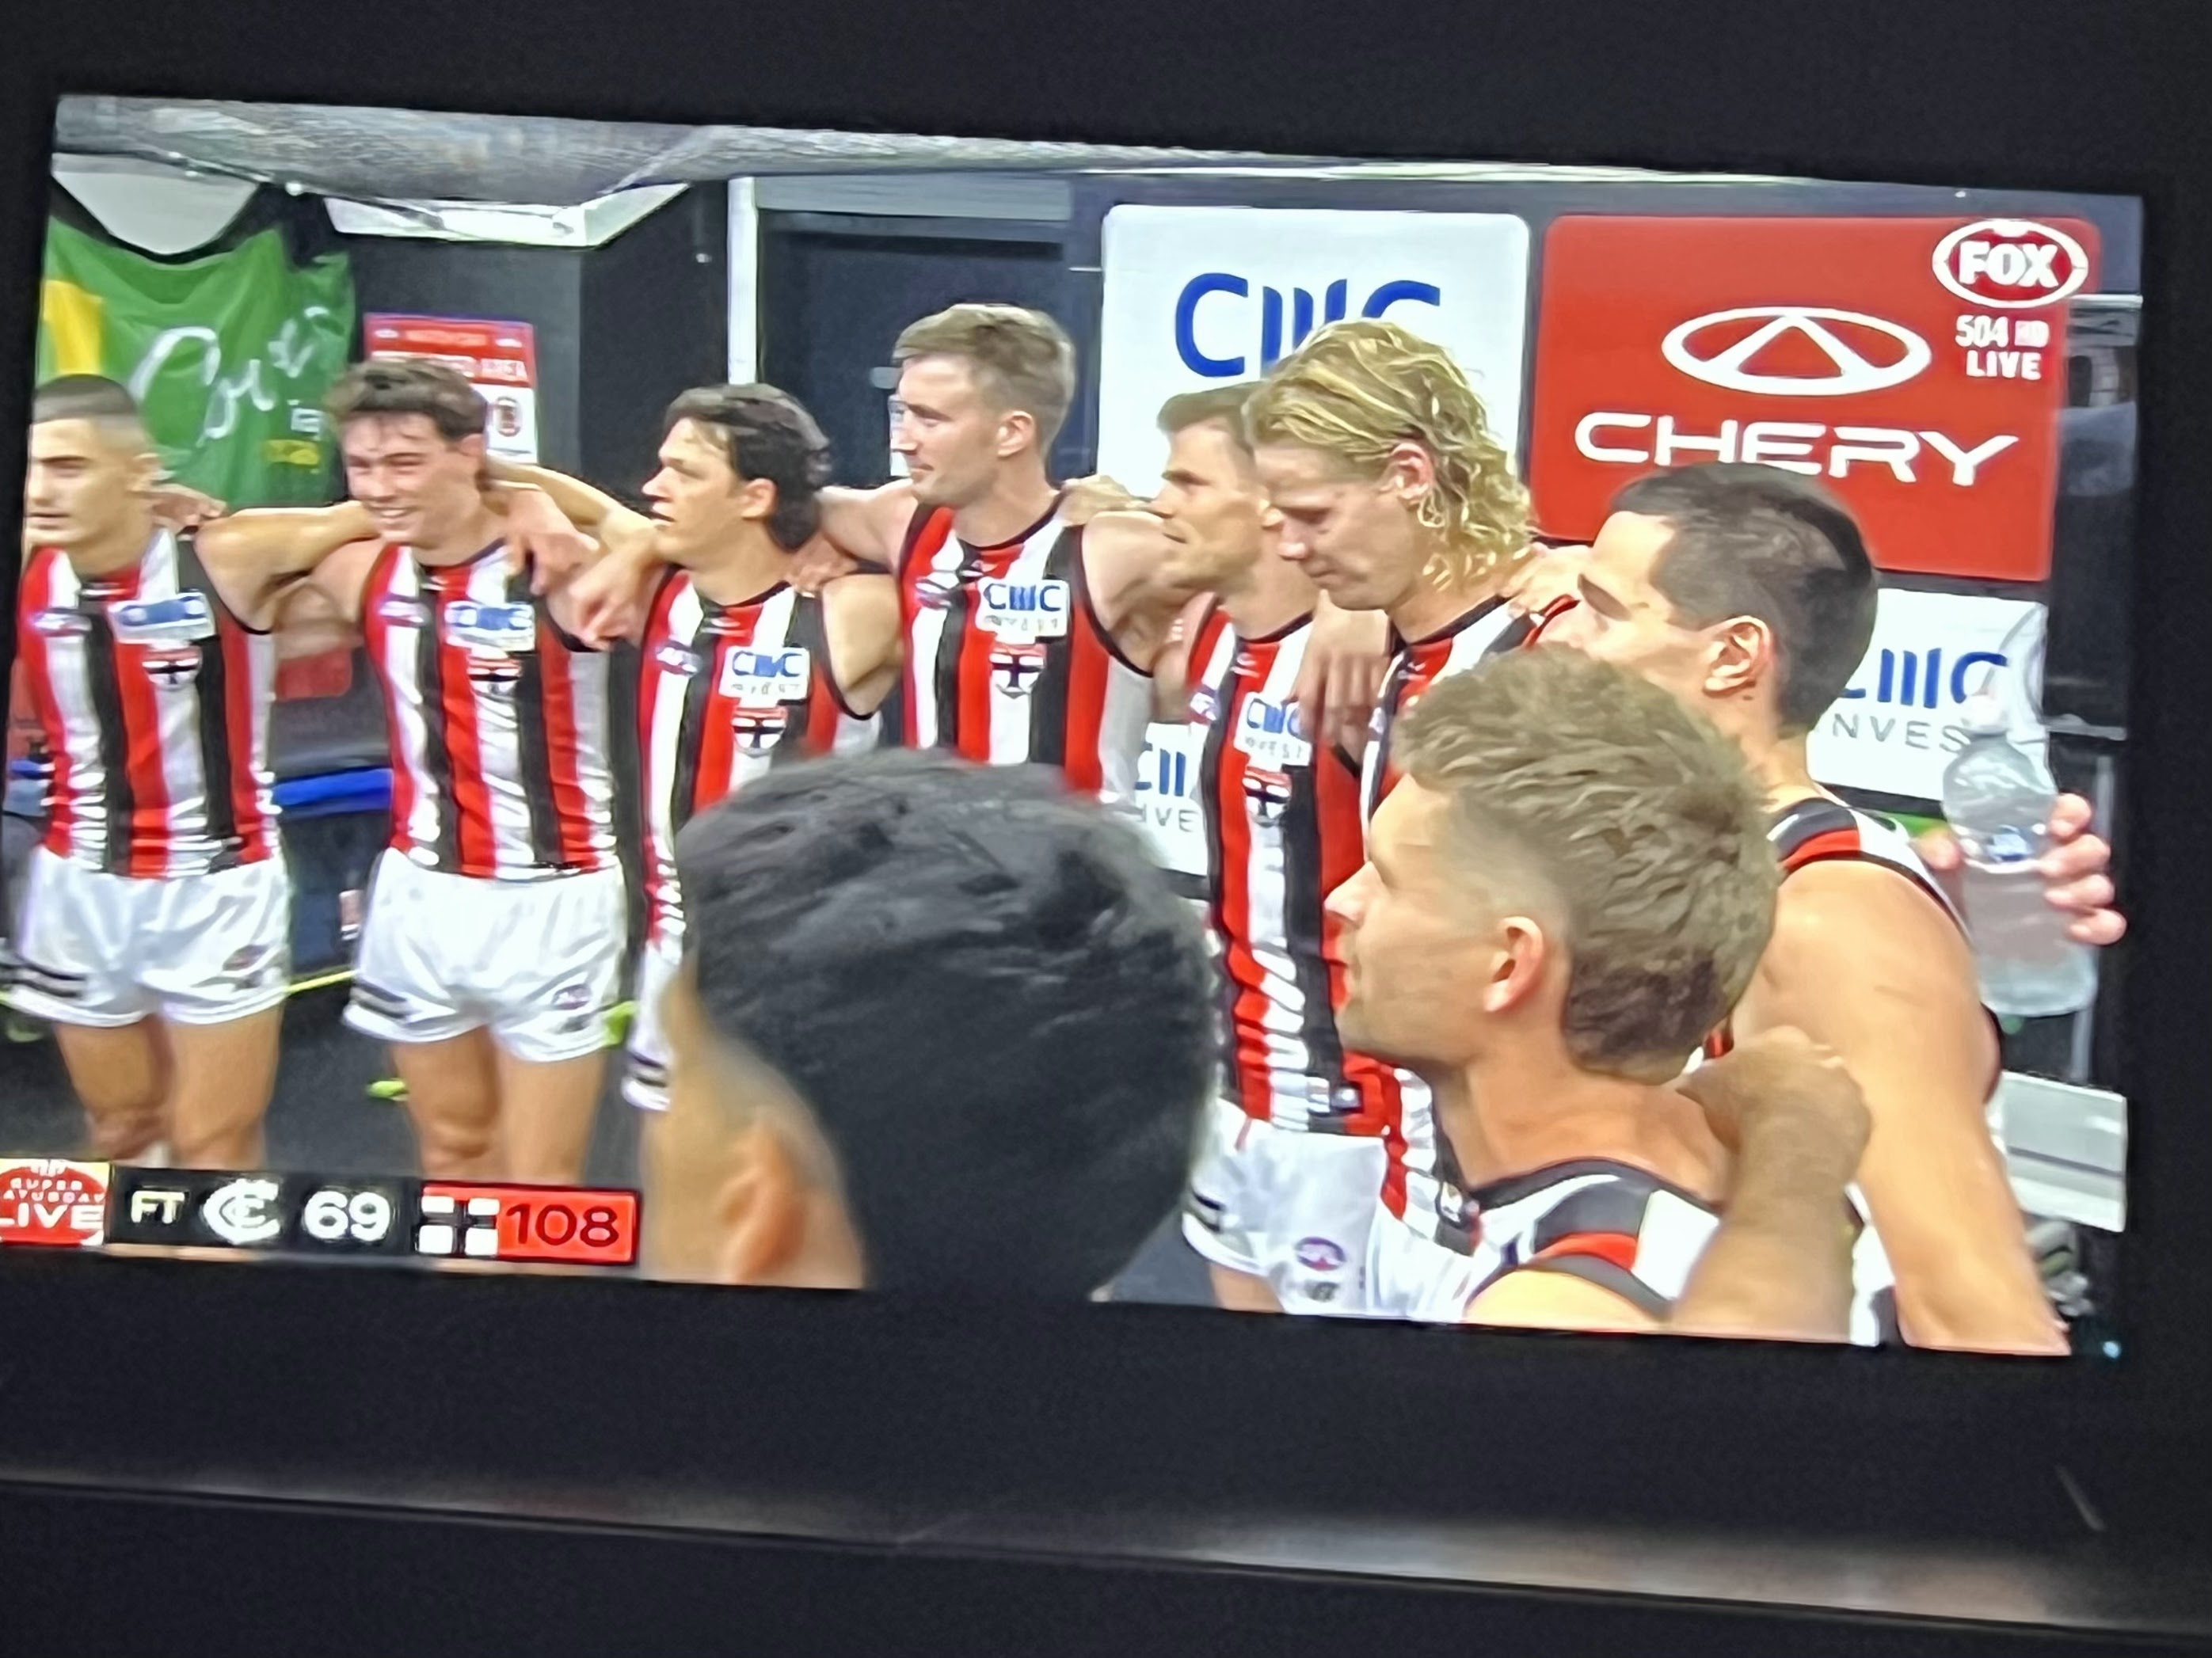
| 8 | Carlton | 16.12 (108) | 9.15 (69) | +39 | Marvel Stadium |
| 10 | Richmond | 16.13 (109) | 11.7 (73) | +36 | Marvel Stadium |
| 20 | North Melbourne | 13.15 (93) | 8.14 (62) | +31 | Marvel Stadium |
| 18 | Port Adelaide | 13.9 (87) | 10.13 (73) | +14 | Marvel Stadium |
| 5 | Port Adelaide | 12.9 (81) | 9.13 (67) | +14 | Adelaide Oval |
| 14 | GWS Giants | 14.12 (96) | 13.10 (88) | +8 | Marvel Stadium |
| 2 | GWS Giants | 11.12 (78) | 10.14 (74) | +4 | ENGIE Stadium |
Losses (13) – Average losing margin: 23.6 points
| Round | Opposition | For | Against | Margin | Venue |
|---|---|---|---|---|---|
| 12 | Hawthorn | 9.13 (67) | 18.11 (119) | -52 | Marvel Stadium |
| 22 | Carlton | 8.14 (62) | 16.10 (106) | -44 | Marvel Stadium |
| 3 | Brisbane Lions | 11.14 (80) | 17.11 (113) | -33 | Marvel Stadium |
| 11 | Fremantle | 11.8 (74) | 16.8 (104) | -30 | Optus Stadium |
| 9 | Gold Coast | 8.12 (60) | 13.11 (89) | -29 | TIO Stadium |
| 19 | Geelong | 11.9 (75) | 15.12 (102) | -27 | GMHBA Stadium |
| 24 | Gold Coast | 12.8 (80) | 14.19 (103) | -23 | Marvel Stadium |
| 15 | Western Bulldogs | 8.13 (61) | 12.11 (83) | -22 | Marvel Stadium |
| 21 | Sydney | 13.10 (88) | 16.11 (107) | -19 | Marvel Stadium |
| 1 | Melbourne | 15.17 (107) | 18.12 (120) | -13 | MCG |
| 0 | Collingwood | 9.12 (66) | 11.12 (78) | -12 | MCG |
| 13 | Sydney | 15.12 (102) | 15.14 (104) | -2 | SCG |
| 6 | Adelaide | 15.12 (102) | 15.13 (103) | -1 | Adelaide Oval |
Win/Loss Margin Summary
When we won, we won big – average margin of 36.3 points. When we lost, we lost by an average of 23.6 points. A 12.7-point gap between winning and losing margins. On good days, convincing. On bad days, it got away from us fast.
Four of our 13 losses were by fewer than 5 points. Adelaide by 1. Sydney by 2. Collingwood by 12. Melbourne by 13. That’s 308 points won, four matches lost. Those games alone would have changed the season.
Our biggest win: 101 points over West Coast in Round 7. Our worst loss: 52 points to Hawthorn in Round 12. That’s a 153-point swing between our best and worst days – a wide range that captures exactly the inconsistency that kept us out of the eight.
Quarter-by-Quarter Breakdown
| Quarter | W | D | L | Points For | Points Against | % |
|---|---|---|---|---|---|---|
| 1st Q | 18 | 0 | 5 | 562 | 382 | 147.1% |
| 2nd Q | 9 | 2 | 12 | 515 | 572 | 90.0% |
| 3rd Q | 8 | 1 | 14 | 488 | 508 | 96.1% |
| 4th Q | 12 | 1 | 10 | 465 | 512 | 90.8% |
| Total | 2,030 | 1,974 | 102.8% | |||
In the first quarter, we won 18 of 23 games and outscored opponents 562 to 382 – a 147% scoring rate. Close to the best opening-term team in the competition.
The game-by-game data tells a more complicated story than those aggregates suggest.
When St Kilda lost the first quarter, they lost the game. Every time. Three Q1 losses (Rounds 0, 12, 24 – against Collingwood, Hawthorn, and Gold Coast) all became match losses. That part holds. 0 from 3.
But here’s the twist: St Kilda won the first quarter in 10 of their 13 losses. They won Q1 against Melbourne, Brisbane, Adelaide, Gold Coast, Fremantle, Sydney (twice), Western Bulldogs, Geelong, and Carlton in Round 22 – and still lost. That’s not a fluky run. That’s a structural problem. The engine was good enough to win the opening term but couldn’t sustain it for four quarters.
The one exception worth noting: Round 23 against Richmond, they lost Q1 and won the game. So they can come from behind – just rarely.
Losing Q1 was fatal. Winning Q1 was no guarantee of anything. That’s the 2026 St Kilda story in one line.
Then the second quarter happened. 9 wins, 12 losses. 515 points scored, 572 conceded. A team that dominates the opening term and then gives it all back in the second. That pattern – explosive start, soft second quarter – defined the season more than anything else. It’s a fitness and structure question as much as a talent one.
The third quarter (8-1-14) was our worst period of the season by win-loss record. Teams adjusted at half time; we didn’t. Lyon will know this. It needs to be the off-season project.
The fourth quarter (12-1-10) shows something more encouraging – we competed hard at the end of games. When the legs tired, we didn’t fold as badly as the third quarter record might suggest. That’s a character indicator, even if it wasn’t enough.
The Injury Context Nobody Should Ignore
The 10-13 record needs to be read against what was happening in the treatment room. We rarely had our best players on the ground – and that’s not a hunch, it’s documented.
Max King – Effectively the Entire Season
King played one AFL game in 757 days. His last game before 2026 was in 2024, a career stuck at 83 games by a succession of knee and calf setbacks. He returned in Round 20 against North Melbourne – Saints won by 31 – and did his hamstring in that game. Gone again. Contracted until 2032, publicly backed by Lyon, reportedly seeking assurances he’d still be considered an AFL player.
The Saints played 23 games without their key forward. That’s a structural absence that shaped every forward structure and every opposition game plan all year.
Jack Sinclair – Captain, Gone at the Worst Time
Sinclair tore the lateral tendon, medial tendon, and soleus in his right calf in the opening minutes of Round 15 against the Western Bulldogs. Dual All-Australian. Captain. Best defender. He missed most of the final eight games.
From Round 15 to Round 24, the Saints went 4-4 without him. Not a collapse – a depleted team competing without its captain and defensive anchor simultaneously.
Nasiah Wanganeen-Milera – Two Separate Stints
Nas had the sort of season that defines careers – elite midfield numbers, Brownlow votes – and he did it across two separate injury absences.
The first came in mid-May. A calf injury ruled him out for the Sir Doug Nicholls Round double-header (R10 vs Richmond, R11 vs Fremantle) and the Round 12 Thursday night clash against Hawthorn. That Hawthorn game – the 52-point hiding that stands as the season’s worst loss – was played without Nas, without King, without Clark, without Ryan, and without Butler, all at the same time. Six players on the injury list simultaneously. The loss looks different in that context.
The second absence came at the death. Nas went into the Round 22 Carlton clash already carrying a hip pointer – he’d missed Thursday training during the week. He lasted minutes before a hamstring strain ended his night and, as it turned out, his season. He missed Round 23 (the Richmond win) and Round 24 (the Gold Coast loss). In one of the most important games of the year for wildcard positioning, the Saints played without their most exciting player and lost by 44 points. They won R23 without him – credit to the rest of the group – but the run home was blunted.
Roughly five games without Nas across the season, three of them among the heaviest losses.
The Mid-May Injury List
On 12 May 2026, the official St Kilda injury list:
- Nasiah Wanganeen-Milera – calf – 3 weeks
- Liam Ryan – calf – 3 weeks
- Dan Butler – hamstring – 2-3 weeks
- Max King – hamstring – 5 weeks
- Hunter Clark – knee – TBC
- Kye Fincher – foot – 6 weeks
Six players. Three of them genuine best-22. Round 12 vs Hawthorn on a Thursday night was played in that context. The 52-point loss at the top of the losses table isn’t a ceiling – it’s what happens when you’re missing half your depth chart.
What This Means for 2027
Nas will be fit. Sinclair will be fit. King – fingers crossed – is young enough, contracted long enough, and motivated enough that you’d back him through a full preseason. Clark and Howard should be back too.
This group played together at full strength for maybe half the season. A 102.8% scoring rate on that basis is encouraging. The question for 2027 isn’t whether the talent is there. It’s whether the list can stay on the park.
So – Was I Right in July?
I wrote that the percentage said yes, the list trajectory said probably, and the injury crisis meant we wouldn’t know until 2027.
The season total percentage came in at 102.8%. Positive. We outscored opponents across the year. That’s the structural improvement I was pointing to in July, and it held.
But the quarter stats tell you why 102.8% didn’t translate to finals. A team that loses the second quarter 9-12 and the third quarter 8-14 is a team that starts well and loses the middle of games. Against top-eight sides, the middle of the game is where it’s decided.
The list is better. Nas had a Brownlow-quality season. Liam Ryan delivered. The depth improved. The culture, from the outside, looks healthier.
The gap between what this team can do and what it consistently produced is a coaching and conditioning problem as much as a list problem. The engine cuts out in the second and third quarters. That’s fixable.
2027
De Koning will be back. Max King should be back. Flanders is a question mark on timing but he’s in the system. The wildcard format stays, so top 10 remains achievable rather than top 8 only.
Fix the second and third quarter drop-off – and there’s no football reason we can’t – and this is a finals team in 2027. Not a premiership contender. A finals team.
I’ve been wrong before. Ask me again after Round 5 next year. 🔴⚪️🖤
Stats sourced from FinalSiren.com.

Leave a Reply